
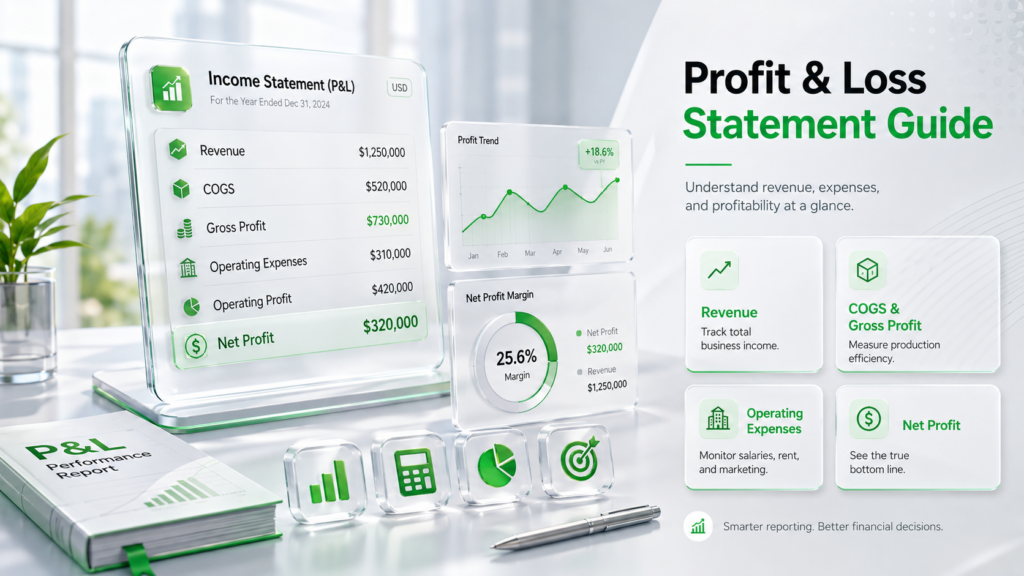
Profit and Loss Statement Guide
A Profit and Loss Statement (P&L Statement) is one of the most essential financial reports every business owner, investor, accountant, and entrepreneur should understand. Whether you operate a small online business, manage a growing company, or simply want to improve your financial literacy, learning how to read a profit and loss statement can help you make smarter business decisions.
Unlike a balance sheet, which shows what a company owns and owes at a specific point in time, a profit and loss statement measures financial performance over a period such as a month, quarter, or year. It summarizes all revenue earned and expenses incurred to determine whether the business generated a profit or suffered a loss during that reporting period. Because it focuses on profitability, it is often called the income statement or statement of earnings.
Think of a profit and loss statement as your business’s financial report card. It tells you how much money came into the business, where that money was spent, and how much remained after covering all costs. Without this information, making pricing decisions, controlling expenses, planning future investments, or applying for financing becomes significantly more difficult.
For startups, established businesses, freelancers, and even nonprofit organizations, the P&L statement provides valuable insights into operational efficiency and long-term sustainability. It highlights trends in revenue growth, identifies rising costs, and helps management determine whether the company is becoming more or less profitable over time.
What Is a Profit and Loss Statement?
A Profit and Loss Statement, commonly abbreviated as a P&L Statement, is a financial report that summarizes a company’s revenues, costs, and expenses over a specific accounting period. Its primary purpose is to determine whether the business earned a profit or incurred a loss during that timeframe. Unlike the balance sheet, which provides a snapshot of financial position on a particular date, the P&L statement focuses on financial performance over time. It answers one of the most important questions every business owner asks: “Is my business making money?”
Every business transaction that affects income or expenses eventually appears in the profit and loss statement. Revenue from product sales, service income, operating costs, salaries, rent, utilities, advertising expenses, taxes, and interest payments all contribute to the final profit figure. Because it presents this information in an organized format, the statement allows business owners to evaluate operational efficiency and identify areas for improvement.
A profit and loss statement is prepared regularly typically every month, quarter, and year. Monthly reports help managers monitor day-to-day performance, while quarterly and annual statements provide a broader picture of financial trends. Public companies are generally required to publish these reports as part of their financial disclosures, while private businesses use them internally for planning and decision-making.
Another advantage of the P&L statement is its ability to support forecasting. By comparing financial results across multiple periods, businesses can identify seasonal trends, estimate future revenue, and prepare realistic budgets. This historical data becomes especially valuable when planning expansion, hiring employees, or launching new products.
Why Every Business Needs a P&L Statement
Regardless of industry or company size, every organization benefits from preparing and analyzing a profit and loss statement. It serves as the foundation for measuring business success because profitability ultimately determines whether a company can survive and grow over the long term. Without accurate financial reporting, business decisions become based on assumptions rather than facts.
One of the biggest advantages of a P&L statement is that it provides a clear view of revenue sources. Business owners can determine which products, services, or customer segments generate the highest income and which contribute the least. This insight helps management allocate resources more effectively and focus on the most profitable opportunities.
Expense management is another critical benefit. Many businesses experience declining profits not because sales are falling, but because expenses are increasing faster than revenue. A profit and loss statement makes these cost increases visible by categorizing operating expenses such as rent, salaries, utilities, insurance, marketing, and administrative costs. Once identified, unnecessary spending can often be reduced without affecting business performance.
The statement also plays an important role in securing financing. Banks and investors rarely rely on sales figures alone. They want evidence that the company consistently generates profits and manages expenses responsibly. A history of positive net income strengthens credibility and improves the likelihood of obtaining loans or attracting investment.
Profit and Loss Statement vs Income Statement
Many beginners believe that a profit and loss statement and an income statement are different financial reports. In reality, they are simply two names for the same document. Depending on the country, accounting standards, or industry, organizations may use either term interchangeably.
The primary objective of both reports is identical: to summarize revenues and expenses over a reporting period and calculate net profit or net loss. Whether the report is labeled “Income Statement,” “Profit and Loss Statement,” “Statement of Operations,” or “Statement of Earnings,” the underlying financial information remains the same.
The terminology often depends on the audience. Small businesses and entrepreneurs frequently use the phrase profit and loss statement, while publicly traded corporations and accounting professionals commonly refer to it as the income statement. Regardless of the title, the structure typically includes revenue, cost of goods sold, gross profit, operating expenses, operating income, taxes, and net income.
It is also helpful to understand how the income statement differs from other major financial statements:
| Financial Statement | Primary Purpose | Time Focus |
|---|---|---|
| Profit and Loss Statement (Income Statement) | Measures profitability | Over a period |
| Balance Sheet | Shows financial position | At a specific date |
| Cash Flow Statement | Tracks cash movement | Over a period |
Components of a Profit and Loss Statement
A profit and loss statement is organized into several key sections that work together to calculate the company’s final profit or loss. Each component tells part of the financial story, and understanding how they connect makes interpreting the statement much easier.
The report begins with revenue, representing the total income earned from normal business activities. From this amount, businesses subtract the cost of goods sold (COGS) to calculate gross profit, which measures the profitability of core operations before administrative expenses. Operating expenses such as salaries, rent, utilities, insurance, and marketing are then deducted to determine operating profit, often referred to as EBIT (Earnings Before Interest and Taxes).
After accounting for non-operating income, interest expenses, and taxes, the final figure becomes net profit, also called the bottom line. This number represents the company’s overall profitability during the reporting period and is one of the most closely watched indicators of business performance.
Each component provides unique insights. Revenue measures market demand, gross profit evaluates production efficiency, operating profit reflects management effectiveness, and net profit summarizes overall financial success. Rather than focusing solely on the bottom line, successful business owners analyze every section to understand exactly where profits are earned and where they may be lost.
The Purpose of Financial Position Reporting
Financial reporting exists to provide accurate and transparent information about a business. The balance sheet is central to this purpose because it summarizes the company’s financial position at a single moment in time.
Revenue
Revenue is the first and one of the most important sections of a profit and loss statement. It represents the total income a business earns from its primary operations before any expenses are deducted. Revenue is often called the top line because it appears at the top of the income statement and serves as the starting point for calculating profitability. For a retail company, revenue comes from selling products, while a consulting firm earns revenue by providing professional services. Subscription businesses generate recurring revenue through monthly or annual customer payments.
Many people confuse revenue with profit, but they are not the same. A company can generate millions of dollars in revenue and still report a net loss if its expenses exceed its income. This is why revenue should always be analyzed alongside costs and operating expenses. Strong revenue growth is generally a positive sign, but it only contributes to long-term success when expenses remain under control.
Cost of Goods Sold (COGS)
After recording revenue, the next major section of the profit and loss statement is the Cost of Goods Sold (COGS). COGS includes the direct costs associated with producing or purchasing the goods and services sold during the reporting period. These costs are directly tied to generating revenue and typically include raw materials, manufacturing labor, packaging, and production overhead. For service-based businesses, COGS may include direct labor costs and materials used to deliver services.
Understanding COGS is essential because it directly impacts profitability. Lower production costs generally result in higher gross profit margins, while rising production expenses reduce profitability even if revenue remains stable. Businesses constantly look for ways to optimize production, negotiate better supplier prices, improve inventory management, and increase operational efficiency to keep COGS under control.
Common examples of costs included in COGS are:
| Included in COGS | Examples |
|---|---|
| Raw Materials | Wood, steel, fabric, ingredients |
| Direct Labor | Factory workers, production staff |
| Manufacturing Supplies | Packaging, labels, production materials |
| Freight-In Costs | Shipping materials to the factory |
| Production Overhead | Equipment directly used in manufacturing |
Gross Profit
Gross profit is calculated by subtracting the Cost of Goods Sold (COGS) from total revenue. It measures how efficiently a business produces or delivers its products and services before accounting for operating expenses such as marketing, rent, and administrative costs.
Formula:
Gross Profit = Revenue − Cost of Goods Sold
For example:
- Revenue: $500,000
- Cost of Goods Sold: $320,000
- Gross Profit: $180,000
This figure indicates how much money remains to cover operating expenses and generate net profit. A growing gross profit usually reflects efficient production, effective pricing strategies, or improved supplier negotiations. Declining gross profit may indicate rising material costs, inefficient operations, increased discounts, or competitive pricing pressure.
Many businesses also monitor their Gross Profit Margin, which is calculated as:
Gross Profit Margin = (Gross Profit ÷ Revenue) × 100
Suppose a company has a gross profit of $180,000 on revenue of $500,000:
Gross Profit Margin = (180,000 ÷ 500,000) × 100 = 36%
Higher gross margins generally indicate stronger pricing power and better operational efficiency, although ideal margins vary significantly across industries. Software companies often have much higher margins than manufacturers because they incur fewer production costs after developing their products.
Operating Expenses
After calculating gross profit, businesses subtract operating expenses, often referred to as Operating Expenses (OPEX). These are the everyday costs required to run the business that are not directly related to producing goods or services. Operating expenses support overall business operations and include administrative, selling, and general expenses.
Typical operating expenses include:
- Employee salaries and wages
- Office rent
- Utilities
- Insurance
- Advertising and marketing
- Office supplies
- Software subscriptions
- Professional fees
- Travel expenses
- Depreciation of office equipment
Unlike COGS, operating expenses continue regardless of production volume. Even if sales temporarily decline, businesses still need to pay rent, employee salaries, insurance premiums, and utility bills. This makes controlling operating expenses an important part of maintaining profitability.
Companies regularly analyze operating expenses to improve efficiency without sacrificing quality. For example, automating repetitive administrative tasks, renegotiating supplier contracts, adopting cloud-based software, or reducing unnecessary travel expenses can significantly lower operating costs.